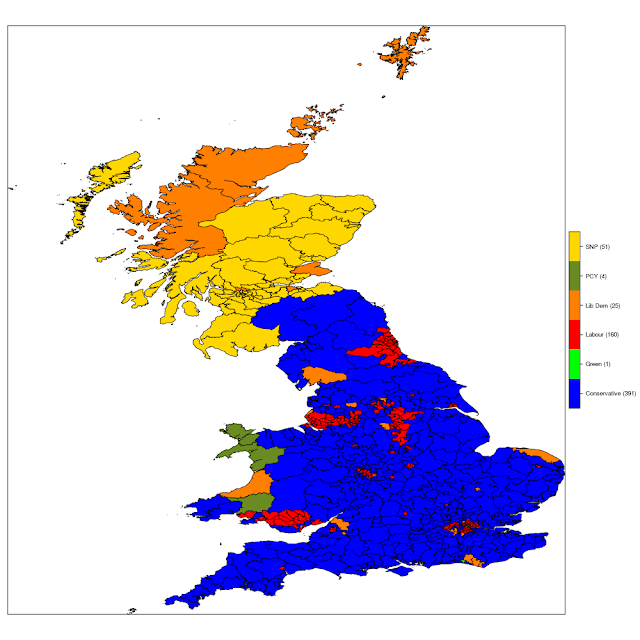
First off: the data. I think that since the announcement of the election, the pollsters have intensified the number of surveys; I have found already 5 national polls (two by Yougov, two by ICM and one by Opinium $-$ there may be more and I'm not claiming a systematic review/meta-analysis of the polls.
Arguably, this election will be mostly about Brexit: there surely will be other factors, but because this comes almost exactly a year after the referendum, it is a fair bet to suggest that how people felt and still feel about its outcome will also massively influence the election. Luckily, all the polls I have found do report data in terms of voting intention, broken up by Remain/Leave. So, I'm considering $P=8$ main political parties: Conservatives, Labour, UKIP, Liberal Democrats, SNP, Green, Plaid Cymru and "Others". Also, for simplicity, I'm considering only England, Scotland and Wales $-$ this shouldn't be a big problem, though, as in Northern Ireland elections are generally a "local affair", with the mainstream parties not playing a significant role.
I also have available data on the results of both the 2015 election (by constituency and again, I'm only considering the $C=632$ constituencies in England, Scotland and Wales $-$ this leaves out the 18 Northern Irish constituencies) and the 2016 EU referendum. I had to do some work to align these two datasets, as the referendum did not consider the usual geographical resolution. I have mapped the voting areas used 2016 to the constituencies and have recorded the proportion of votes won by the $P$ parties in 2015, as well as the proportion of Remain vote in 2016.
For each observed poll $i=1,\ldots,N_{polls}$, I modelled the observed data among "$L$eavers" as $$y^{L}_{i1},\ldots,y^{L}_{iP} \sim \mbox{Multinomial}\left(\left(\pi^{L}_{1},\ldots,\pi^{L}_{P}\right),n^L_i\right).$$ Similarly, the data observed for " $R$emainers" are modelled as $$y^R_{i1},\ldots,y^R_{iP} \sim \mbox{Multinomial}\left(\left(\pi^R_{1},\ldots,\pi^R_P\right),n^R_i\right).$$
In other words, I'm assuming that within the two groups of voters, there is a vector of underlying probabilities associated with each party ($\pi^L_p$ and $\pi^R_p$) that are pooled across the polls. $n^L_i$ and $n^R_i$ are the sample sizes of each poll for $L$ and $R$.
I used a fairly standard formulation and modelled $$\pi^L_p=\frac{\phi^L_p}{\sum_{p=1}^P \phi^L_p} \qquad \mbox{and} \qquad \pi^R_p=\frac{\phi^R_p}{\sum_{p=1}^P \phi^R_p} $$ and then $$\log \phi^j_p = \alpha_p + \beta_p j$$ with $j=0,1$ to indicate $L$ and $R$, respectively. Again, using fairly standard modelling, I fix $\alpha_1=\beta_1=0$ to ensure identifiability and then model $\alpha_2,\ldots,\alpha_P \sim \mbox{Normal}(0,\sigma_\alpha)$ and $\beta_2,\ldots,\beta_P \sim \mbox{Normal}(0,\sigma_\beta)$.
This essentially fixes the "Tory effect" to 0 (if only I could really do that!...) and then models the effect of the other parties with respect to the baseline. Negative values for $\alpha_p$ indicate that party $p\neq 1$ is less likely to grab votes among leavers than the Tories; similarly positive values for $\beta_p$ mean that party $p \neq 1$ is more popular than the Tories among remainers. In particular, I have used some informative priors by defining the standard deviations $\sigma_\alpha=\sigma_\beta=\log(1.5)$, to mean that it is unlikely to observe massive deviations (remember that $\alpha_p$ and $\beta_p$ are defined on the log scale).
I then use the estimated party- and EU result-specific probabilities to compute a "relative risk" with respect to the observed overall vote at the 2015 election $$\rho^j_p = \frac{\pi^j_p}{\pi^{15}_p},$$ which essentially estimates how much better (or worse) the parties are doing in comparison to the last election, among leavers and remainers. The reason I want these relative risks is because I can then distribute the information from the current polls and the EU referendum to each constituency $c=1,\ldots,C$ by estimating the predicted share of votes at the next election as the mixture $$\pi^{17}_{cp} = (1-\gamma_c)\pi^{15}_p\rho^L_p + \gamma_c \pi^{15}_p\rho^R_p,$$ where $\gamma_c$ is the observed proportion of remain voters in constituency $c$.
Finally, I can simulate the next election by ensuring that in each constituency the $\pi^{17}_{cp} $ sum to 1. I do this by drawing the vote shares as $\hat{\pi}^{17}_{cp} \sim \mbox{Dirichlet}(\pi^{17}_1,\ldots,\pi^{17}_P)$.
In the end, for each constituency I have a distribution of election results, which I can use to determine the average outcome, as well as various measures of uncertainty. So in a nutshell, this model is all about i) re-proportioning the 2015 and 2017 votes based on the polls; and ii) propagating uncertainty in the various inputs.
I'll update this model as more polls become available $-$ one extra issue then will be about discounting older polls (something like what Roberto did here and here, but I think I'll keep things easy for this). For now, I've run my model for the 5 polls I mentioned earlier and this is the (rather depressing) result.
The following table shows the predicted "swings" $-$ who's stealing votes from whom:
Conservative Green Labour Lib Dem PCY SNP
Conservative 325 0 0 5 0 0
Green 0 1 0 0 0 0
Labour 64 0 160 6 1 1
Liberal Democrat 0 0 0 9 0 0
Plaid Cymru 0 0 0 0 3 0
Scottish National Party 1 0 0 5 0 50
UKIP 1 0 0 0 0 0
Again, at the moment, bad day at the office for Labour who fails to win a single new seat, while losing over 60 to the Tories, 6 to the Lib Dems, 1 to Plaid Cymru in Wales and 1 to the SNP (which would mean Labour completely erased from Scotland). UKIP is also predicted to lose their only seat $-$ but again, this seems a likely outcome.


Would you care to share your scripts? I would be interested to play around with this!
ReplyDeleteI want to make some changes to the model, to include a few other features (eg to anchor the estimated vote shares to some historic data, in order to have a more robust estimate and safeguard against "over-enthusiastic" polls). Will post again with more detail, when I have a moment...
ReplyDelete